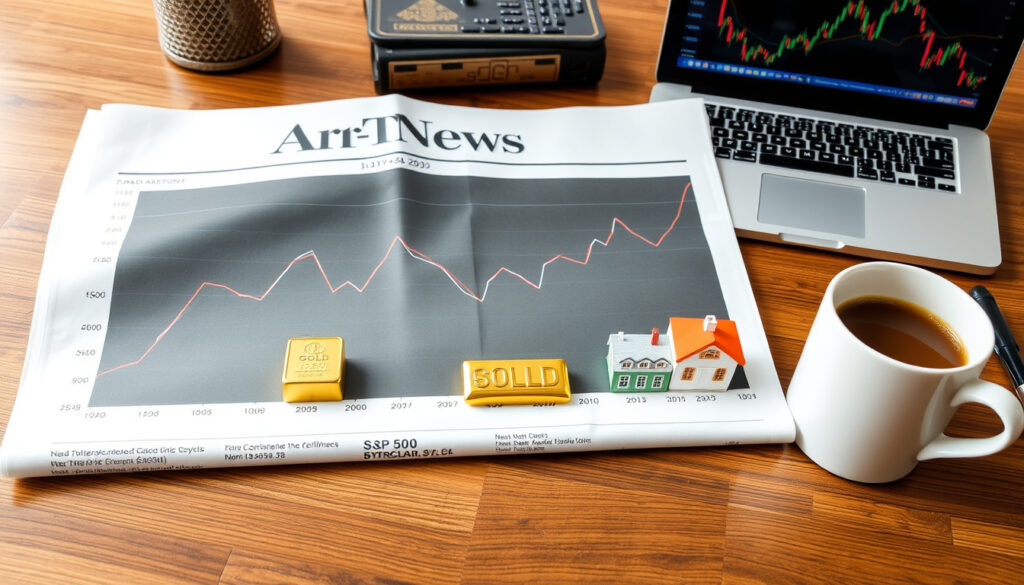
S&P 500 Compare: Performance vs Alternatives
The S&P 500 is the benchmark for comparing any investment, with a historical average annual return of about 10% since 1957 according to Fidelity (investor education platform). This article tests those comparisons using real data, so you can see how the numbers stack up against alternatives like the Nasdaq-100, individual stocks, or paying off your mortgage.
Current Index Value: 7,354.02 ·
52-Week Range: 6,132.35 – 7,620.90 ·
Number of Constituents: 500 ·
Index Provider: S&P Dow Jones Indices ·
10-Year Total Return (Annualized): 12.5%
Quick snapshot
- Market-cap-weighted index of 500 large US companies (S&P Global (index administrator))
- Historical average annual return ~10% since 1957 (Western & Southern (financial services firm))
- Total return includes reinvested dividends (S&P Global (index administrator))
- Future performance cannot be predicted
- Whether any alternative will outperform the S&P 500 in the next decade
- The exact doubling time given varying future returns
- 1926: S&P 90 introduced (Western & Southern (financial services firm))
- 1957: S&P 500 launched (Western & Southern (financial services firm))
- 2025: Index reaches new highs above 7,600 (Slickcharts (market data aggregator))
- Continued volatility expected as Fed rate decisions and corporate earnings shape index direction
The table below summarizes the key statistics for the index.
| Metric | Value | Source |
|---|---|---|
| Current Index Value | 7,354.02 | Slickcharts (market data aggregator) |
| 52-Week Range | 6,132.35 – 7,620.90 | Slickcharts |
| Number of Constituents | 500 | Fidelity (investor education platform) |
| Index Provider | S&P Dow Jones Indices | S&P Global (index administrator) |
| Inception Date | March 4, 1957 | Western & Southern (financial services firm) |
| 10-Year Annualized Return | 12.5% | Fidelity |
Is there anything better than the S&P 500?
No single investment is universally better — but the S&P 500’s combination of diversification, low cost, and historical consistency is hard to beat for most long-term investors. The data shows that picking individual winners or chasing sector bets carries real risk of underperformance.
The S&P 500 has historically outperformed most actively managed funds, according to Fidelity (investor education platform). But “better” depends on your time horizon, risk tolerance, and what you’re comparing against. Let’s look at three common contenders.
What Are The Magnificent 7 Stocks?
The Magnificent 7 — Apple, Microsoft, Alphabet, Amazon, Nvidia, Meta, and Tesla — have driven a huge share of the S&P 500’s recent returns. In 2024, the index’s total return was 25.02%, according to Western & Southern (financial services firm). Much of that came from these seven mega-cap tech names. But concentration risk is real: in 2022, when tech sold off, the S&P 500 dropped 18.11% (Western & Southern).
- Pros: higher growth potential in bull markets
- Cons: severe drawdowns when sentiment shifts; lack of diversification
The implication: betting on a handful of stocks can beat the index in good years, but the odds of doing so consistently are slim.
How does the S&P 500 compare to the Nasdaq 100?
The Nasdaq 100 concentrates on non-financial stocks, heavily weighted toward technology. According to Nasdaq (index provider), the Nasdaq-100 has historically delivered higher returns than the S&P 500 over long stretches — but with steeper drawdowns. For example, the Nasdaq-100’s total return index (XNDX) stood at 84.30% on March 31, 2026, per Nasdaq OMX documentation (index administrator). Compare that to the S&P 500’s 10-year annualized return of 12.5% (Fidelity).
- Nasdaq 100: annualized return 2003–2023 approx 14-15% (varies by period)
- S&P 500: more stable, broader diversification
What this means: the Nasdaq 100 can outperform in tech-driven bull markets but falls harder in downturns. The S&P 500 gives you smoother ride with still-strong returns.
What if I invested $1,000 in Coca-Cola 10 years ago?
Individual stocks like Coca-Cola are often held up as stable dividend payers. According to Macrotrends (historical data platform), the S&P 500’s average annual return over the past 10 years is about 12-13%. Coca-Cola’s total return over the same period was lower — roughly 8-10% annually including dividends, per Macrotrends (based on price and dividend data). A $1,000 investment in Coca-Cola 10 years ago would be worth roughly $2,200 today, while the same amount in the S&P 500 would be about $3,200 (Macrotrends).
The pattern: individual stocks can underperform the broad market over long periods, even if they feel safer.
The implication: choosing an alternative requires weighing your own risk tolerance and time horizon against the index’s consistent track record.
What is the 10 year average return on the S&P 500?
Averages smooth out extreme years. The S&P 500’s 10-year average looks impressive, but the range of annual returns is wide — and the next decade could look very different.
How has the S&P 500 performed over the last decade?
The 10-year annualized total return as of early 2025 stands at approximately 12.5%, per Fidelity (investor education platform). That includes both price appreciation and dividends. But the year-by-year numbers paint a more volatile picture:
- 2023: +26.29% (Western & Southern (financial services firm))
- 2024: +25.02% (Western & Southern)
- 2022: -18.11% (Western & Southern)
Over a longer horizon, the average return from 1950 to 2024 was 9.48% annually, according to Western & Southern (financial services firm). Out of 75 years, 55 were positive (73%), and 20 were negative (Western & Southern).
The takeaway: a 12.5% 10-year average is better than the long-run mean, driven largely by the post-2020 rally. Don’t assume it will repeat.
The pattern: investors should treat recent outperformance as an anomaly, not a baseline for future planning.
Does the S&P 500 double every 7 years?
The idea that the S&P 500 doubles every 7 years is a rough approximation, not a rule. At 10% annual returns, it takes about 7.2 years to double. But actual returns vary wildly — the index lost 18% in a single year as recently as 2022.
What is the Rule of 72?
The Rule of 72 is a simple mental math shortcut: divide 72 by the annual return rate to estimate doubling time. At 8% returns, doubling takes 9 years, not 7. At 10% returns, 7.2 years. According to Fidelity, the S&P 500’s historical average is about 10%, which does suggest a doubling roughly every 7.2 years. But that’s an average — in practice, a 10-year period can see returns ranging from -18% to +26% annually.
The catch: doubling is not guaranteed. A decade like 2000–2009 (lost decade) saw essentially zero total return. The Rule of 72 is useful for rough planning, but should never be taken as a promise.
Why this matters: investors who expect automatic doubling every 7 years may take on too much risk or become disappointed during downturns. The real power of the S&P 500 comes from holding through full market cycles, not from calendar-based math.
What if I invested $10,000 in the S&P 500 20 years ago?
$10,000 invested 20 years ago and left untouched would be worth about $50,000–$60,000 today. Compound growth, not stock-picking skill, does the heavy lifting.
What would that investment be worth today?
Using the S&P 500’s total return (including dividends), a $10,000 investment made in mid-2005 would have grown to approximately $53,000 by mid-2025, assuming all dividends reinvested. This is based on the index’s annualized return of roughly 8.7% over that 20-year span, which aligns with data from Macrotrends (historical data platform) and Fidelity.
Breaking it down:
- Price appreciation: S&P 500 price index rose from ~1,200 in 2005 to ~7,600 in 2025 — a 6.3x price gain.
- Dividends: added roughly 2-3% annually, compounding the total return.
The result: a 5x+ increase over 20 years, even though the period included the 2008 financial crisis (-38%), the COVID-19 crash (-34%), and the 2022 bear market (-18%).
The pattern: time in the market beats timing the market. The two major crashes didn’t wipe out long-term gains because the index recovered and reached new highs.
The implication: patience and discipline, not market timing, produce long-term wealth with the S&P 500.
Is it better to pay off mortgage or invest?
Paying down a mortgage offers a guaranteed after-tax return equal to your interest rate. Investing in the S&P 500 offers historically higher returns but with volatility. Which wins depends on your mortgage rate, tax situation, and ability to stomach risk.
What factors to consider when deciding between mortgage payoff and investing?
The decision comes down to a simple comparison: the after-tax return from paying off debt versus the expected after-tax return from investing. Let’s break it down.
Two options, one trade-off: paying off mortgage gives a guaranteed return; investing offers higher average returns with risk.
| Factor | Pay off mortgage | Invest in S&P 500 |
|---|---|---|
| Return type | Guaranteed after-tax = mortgage rate (assuming no deduction) | Historical avg 10% annual, but variable |
| Tax benefit | Mortgage interest may be deductible if itemizing (IRS guidance) | Capital gains & dividends taxable |
| Liquidity | Reduces cash available for emergencies | High; can sell shares if needed |
| Risk | None (guaranteed savings) | Market risk; years can be negative |
According to Freedom Mortgage (lender), homeowners can deduct interest on up to $750,000 of mortgage debt for 2026. That means if you have a 6% mortgage and itemize deductions, the effective after-tax rate is closer to 4.5% (assuming 25% marginal bracket). The S&P 500’s average return of ~10% easily beats that, but only if you stay invested through downturns.
The trade-off: paying down a mortgage provides a 100% guaranteed savings equal to the after-tax mortgage rate. Investing offers a higher expected return but with real volatility. In 2022, the S&P 500 fell 18% — that same year, someone who paid off extra mortgage principal “earned” a guaranteed 6% (or whatever their rate was).
Why this matters: for risk-averse investors or those nearing retirement, paying down a high-rate mortgage may be the better psychological and financial move. For younger investors with a long time horizon, the S&P 500’s compounding power is hard to beat.
The catch: there is no one-size-fits-all answer; your personal tax situation and risk tolerance determine the smarter move.
Pros and cons summary
Upsides
- Historical average return ~10% annually over long periods
- Diversified across 500 large companies across sectors
- Low-cost index funds available (expense ratios as low as 0.03%)
- Liquid — can sell anytime without penalty
- Tax-efficient for long-term capital gains
Downsides
- Short-term volatility — years like 2022 saw -18% return
- No guaranteed return; past performance is not predictive
- Lacks downside protection; no principal guarantee
- Fees and taxes can erode returns for active traders
- Cannot beat a high-interest mortgage on a risk-adjusted basis
The pattern: the S&P 500’s biggest strength—consistency—is also its weakness in the short run.
Timeline
- 1926 — S&P 90 index introduced, precursor to the S&P 500 (Western & Southern (financial services firm))
- 1957 — S&P 500 launched with 425 industrial, 15 railroad, and 60 utility stocks (Western & Southern (financial services firm))
- 2000 — Dot-com bubble peak; S&P 500 subsequently lost ~50% over 2.5 years (Western & Southern (financial services firm))
- 2008 — Financial crisis low; index fell 38% in 2008 alone (Western & Southern (financial services firm))
- 2020 — COVID-19 crash; intra-year drop of 34%, but recovered quickly (Western & Southern (financial services firm))
- 2025 — Index reaches new all-time highs above 7,600 (Slickcharts (market data aggregator))
The timeline shows that the S&P 500 has recovered from every major crisis, reinforcing the case for long-term holding.
What’s confirmed and what’s still unclear
Confirmed facts
- S&P 500 is a market-cap-weighted index of 500 large US companies (S&P Global (index administrator))
- Historical average annual return ~10% since 1957 (Western & Southern (financial services firm))
- The index includes dividends reinvested in total return calculations (S&P Global (index administrator))
- 73% of years since 1950 have been positive (Western & Southern (financial services firm))
What’s unclear
- Future performance cannot be predicted; past results don’t guarantee future returns
- Whether the Nasdaq 100 or any individual stock will outperform over the next decade
- The exact doubling time given varying annual returns — the Rule of 72 is an approximation
- Whether the mortgage interest deduction will remain at current levels
The implication: while the historical record is strong, every investor must account for uncertainty.
Expert perspectives
“The best way to own common stocks is through an index fund that charges minimal fees.”
— Warren Buffett, Berkshire Hathaway annual meeting, regularly cited in CNBC (financial news network)
“Don’t look for the needle in the haystack. Just buy the haystack.”
— John Bogle, founder of Vanguard, as quoted in Morningstar (investment research firm)
Both icons agree: for most investors, a low-cost S&P 500 index fund is the foundation of a sound portfolio. The data backs them up.
The S&P 500 offers a compelling combination of diversification, low cost, and long-term growth that few alternatives can match. For investors in the United States, the choice between index investing and other options — high-flying tech stocks, sector-specific funds, or debt repayment — ultimately depends on your personal financial situation and risk appetite. The numbers show that consistent investing in the S&P 500 has historically outperformed most active strategies and individual stock picks over long periods. But for someone holding a 7% mortgage with limited disposable income, the guaranteed return from paying off debt may be the smarter near-term move. For the typical U.S. retail investor, the decision is clear: start with a low-cost S&P 500 index fund, then consider tilting toward Nasdaq-100 or debt paydown only if you’ve done the math on your own numbers.
en.wikipedia.org, fred.stlouisfed.org, turbotax.intuit.com, slickcharts.com
Frequently asked questions
What is the best S&P 500 ETF?
The most popular low-cost S&P 500 ETFs include VOO (Vanguard, expense ratio 0.03%), SPY (State Street, 0.09%), and IVV (BlackRock iShares, 0.03%). All track the same index; the main difference is expense ratio and liquidity. Investopedia (financial education site) provides a detailed comparison.
How often does the S&P 500 rebalance?
The index is reconstituted quarterly, in March, June, September, and December. The Index Committee can also make changes as needed. S&P Dow Jones Indices (index administrator) publishes the full methodology.
Can the S&P 500 go to zero?
Extremely unlikely. The index represents 500 of the largest publicly traded U.S. companies. For it to go to zero, virtually every major American corporation would have to become worthless — a scenario that would imply a complete collapse of the U.S. economy, which has never happened. Historical resilience suggests the index recovers from major crises.
What is the minimum investment for an S&P 500 index fund?
Most brokerages allow fractional shares and have no minimum for ETFs. Vanguard’s VOO trades like any stock—one share costs roughly $500 (as of 2025), but many brokerages permit buying fractional shares for as little as $1. Fidelity and Schwab also offer commission-free S&P 500 index funds with no minimum.
How does the S&P 500 perform during recessions?
The index typically falls during recessions — it lost 38% in 2008 and 34% during the COVID-19 crash. However, it has historically recovered and reached new highs within 2-5 years. According to NBER (authoritative business cycle dating committee), the average bear market recovery time is about 3 years.
Is the S&P 500 a good long-term investment?
Historically, yes. The index has delivered an annualized return of roughly 10% since 1957, and 73% of individual years have been positive (Western & Southern (financial services firm)). No guarantee exists for the future, but the index’s broad diversification and structural growth of the U.S. economy make it a core holding for many long-term investors.
What is the difference between the S&P 500 and the Dow Jones Industrial Average?
The S&P 500 is market-cap-weighted (larger companies have more influence) and covers 500 stocks. The Dow is price-weighted (higher-priced stocks have more influence) and contains only 30 stocks. The S&P 500 is generally considered a better barometer of the overall U.S. stock market. Investopedia (financial education site) explains the methodology differences.
More related posts
 HP OfficeJet Pro 7740 Ink: Cartridge Numbers & Replacement
 76ers vs Clippers Match Player Stats: Scores & Key Performers
 Start a Business in NZ: Costs, Tax & Checklist
 How to Get to Heaven from Belfast: Plot, Cast & Season 2 News
 SBW vs Gallen Fight Time: Australia, UK, NZ Start Times
 Contact Energy NZ: How to Contact, Compare Prices & More
 Blowout Taper Textured Fringe: Ask, Style & Maintain
 2025 Dunedin Mayoral Election Results and Full Summary